- View more resources from this publisher
 Institute of Physics (IOP)
 - View more resources from this publisher
 Institute of Physics and Engineering in Medicine
Tooltip
These resources have been reviewed and selected by STEM Learning’s team of education specialists for factual accuracy and relevance to teaching STEM subjects in UK schools.
Electrocardiagrams
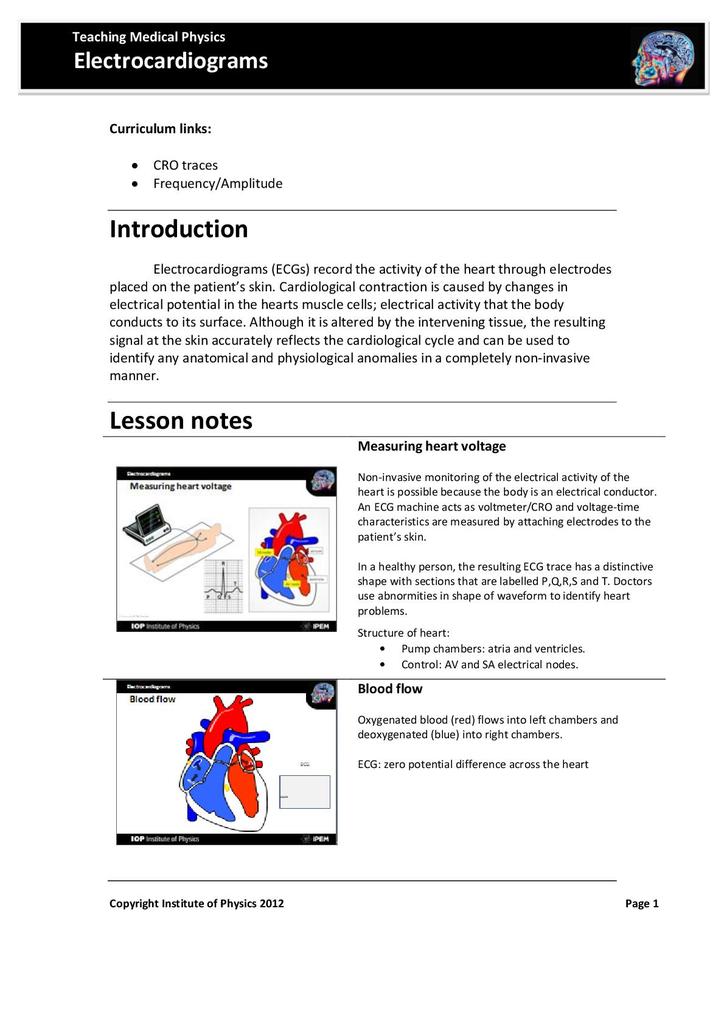
This resource from the Institute of Physics, describes how electrocardiagrams (ECGs) record the activity of the heart through electrodes placed on a patient's skin. The teacher's notes contain an introduction to ECGs and lesson notes for the associated PowerPoint file. A mark scheme for the worksheet is also included. The worksheet contains questions that could be used as a summative test on the topic (10 marks). The animated PowerPoint shows how blood flow and muscle contraction within the heart is related to the ECG trace. The graphs show how heart rate can be calculated by measuring the period between successive peaks on the ECG.
Show health and safety information
Please be aware that resources have been published on the website in the form that they were originally supplied. This means that procedures reflect general practice and standards applicable at the time resources were produced and cannot be assumed to be acceptable today. Website users are fully responsible for ensuring that any activity, including practical work, which they carry out is in accordance with current regulations related to health and safety and that an appropriate risk assessment has been carried out.
Downloads
-
Electrocardiagrams (teachers' notes) 477.08 KB
-
Electrocardiagrams (activity sheet) 507.5 KB
-
Electrocardiagrams 1.36 MB
Show downloads
-
 Electrocardiagrams (teachers' notes) 477.08 KB
 -
 Electrocardiagrams (activity sheet) 507.5 KB
 -
 Electrocardiagrams 1.36 MB
Download all files as a .zip1.81 MB
Information on the permitted use of this resource is covered by the Category Three Content section in STEM Learning’s Terms and conditions.


