Resources
Comparing and Ordering – Numbers and Quantities
This series of interactive excel sheets aimed at Reception students explores comparing and ordering both numbers and quantities. Answers can be checked each time and new questions generated at the click of a button.
...
Comparing arctic and global temperatures
In this activity students are required to test the following statement: “It is very likely that the Arctic has warmed at more than twice the global rate over the past 50 years” Students calculate different averages, complete graphs and interpret the results.
Comparing arctic and global temperatures using excel
In this activity students are asked to test the statement: “It is very likely that the Arctic has warmed at more than twice the global rate over the past 50 years”
Students are asked to use an Excel spreadsheet to calculate averages, maximum values and minimum values and draw line graphs. Students use a...
Comparing data using statistical measures
This is a concept development lesson, designed to help students make meaningful comparisons between data sets. There is a particular focus on central tendency and variability. Topics covered include:
- Mean
- Median
- Outliers
- Standard deviation
- Mean absolute deviation...
Comparing Datasets
This activity is produced by the Maths Magic project. Comparing Datasets provides examples and ideas for comparing data using mean, mode median, interquartile range and standard deviation. The examples suggested are:
- Do males have faster reaction times than females?
- Is life expectancy higher...
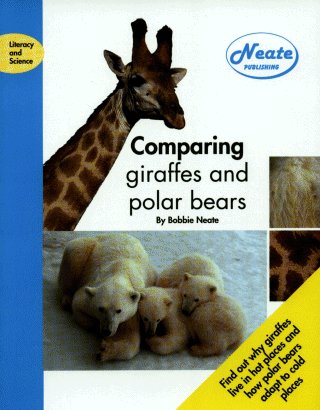
Part of the 'Literacy and science' series, this book compares two animals which live in very different parts of the world. It describes how animals have adapted to either the heat of Africa or the frozen and ice-...
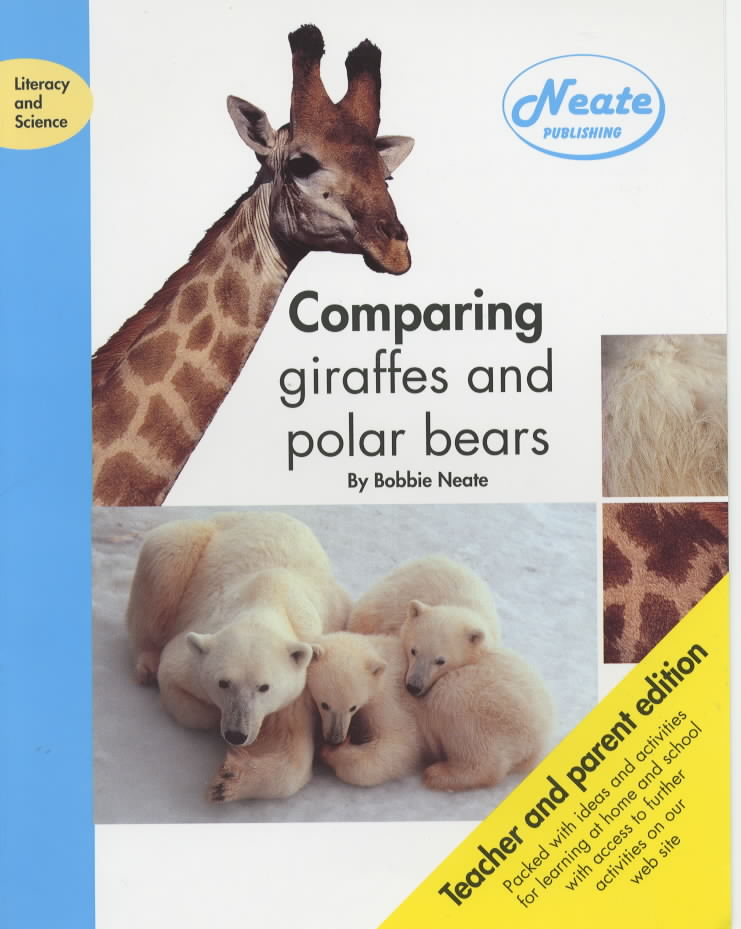
Part of the 'Literacy and science' series, this book compares two animals which live in very different parts of the world. It describes how animals have adapted to either the heat of Africa or the frozen and ice-...
Comparing lines and linear equations
This resource develops the concept of interpreting speed as the slope of a linear graph. There is also work on translating between the equation of a line and its graphical representation.
Students consider a graph drawn to model the flow between two identical right rectangular prisms. There are subsequent...
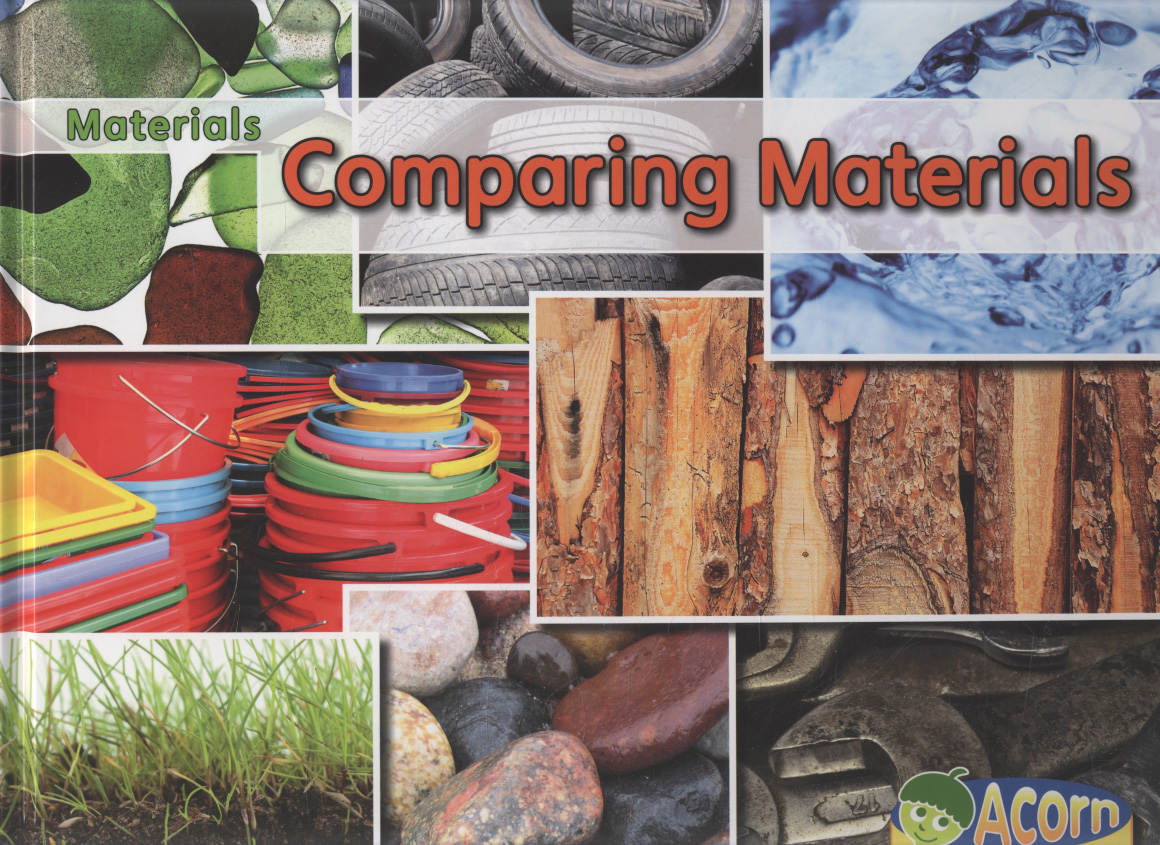
'Comparing materials' introduces young learners to the properties, sources and uses for many different materials.

'Comparing properties' introduces young learners to the idea of materials having different properties, such as hard or soft, heavy or light, and shiny or dull. Readers will learn that some materials can have a range...